- The
 can be used to calculate the
concentration of a product.
The initial rate is
can be used to calculate the
concentration of a product.
The initial rate is 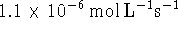 .
.
- With this much data, it's best to use a graphical method.
It simplifies certain calculations is you convert the
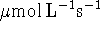 to
to  .
The order of the reaction is 1. The rate constant is
.
The order of the reaction is 1. The rate constant is
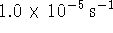 .
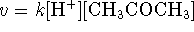
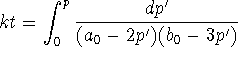
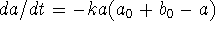
. - Not elementary. Hint: It has something to do with the rate law.
-
 with
with 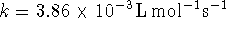
-
-
 .
Your answer may look a little different from mine, but
you should get the same results in the next part if you
did this right.
.
Your answer may look a little different from mine, but
you should get the same results in the next part if you
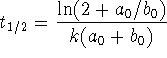
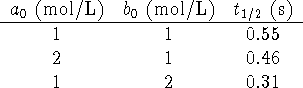
did this right. - The following table shows the half-life computed for a
few different initial conditions:
- Plot ln P vs t, the slope is the specific growth rate of the population (k). The doubling time computed from k is 77y.
- Prediction is tricky. My fit of the data is

We are looking for the t at which
 .
I get about 2005. However, if you plot all the data,
you will see that the graph of
.
I get about 2005. However, if you plot all the data,
you will see that the graph of  vs t has
considerable curvature. The population growth is in
fact slowing down. If I refit only the data from the
last two decades (which should give a much more accurate
estimate of the current rate of growth), I predict that
the Finnish population will reach 6 million in 2031.
vs t has
considerable curvature. The population growth is in
fact slowing down. If I refit only the data from the
last two decades (which should give a much more accurate
estimate of the current rate of growth), I predict that
the Finnish population will reach 6 million in 2031. - See above.