AusWeb: What Did We Say? A Qualitative Data Analysis of the
Papers
J. Dale Burnett
dale.burnett@uleth.ca
University of Lethbridge
and
Allan Ellis
aellis@scu.edu.au
Southern Cross University
Abstract
Qualitative data analysis techniques were applied to the papers from four
AusWeb conferences in the period 1995 to 2001 to provide a metadata description
of the themes and topics. Comparisons among the descriptions for the four
conferences were then made in a search for commonalties and trends. Using
the four major categories of Education, Technical, Business and Society, a
number of patterns were identified. Education papers showed a shift away from
building operational Web sites to a concern for pedagogical principles that
take into account the technological character of the Web. Design, collaboration
and a concern for the learning process became increasingly mentioned. Technical
papers maintained a focus on integrating database technologies with the Web,
interest shifting from cgi-scripts to client-side approaches as well as to
new software developments such as DHTML and XML. Business papers, as might
be expected, focused on e-commerce but with a continuing interest in small
business environments. Society papers have predictably discussed social issues
such as equity, gender bias, government control, privacy and security.
1. Introduction
This paper addresses two questions: (1) can Qualitative Data Analysis (QDA)
software be utilized to provide a relatively quick description of several
sets of conference proceedings and (2) can such an analysis identify key issues,
trends and patterns?
The strategy was to first examine the most recent conference, AusWeb01, to
see if a qualitative data analysis would yield a useful, empirically grounded,
description. This being the case, we then reviewed the papers from the first
conference, AusWeb95. This was followed by squeezing in from both ends, looking
at AusWeb2K and AusWeb96, in order to make more substantive statements about
the differences in the descriptions and to comment on possible trends over
the years 1995 to 2001.
The authors would like to note that there is much more to a conference than
just the papers: keynote sessions, tutorials and workshops, panel discussions,
poster presentations and the opportunity to network informally on either a
one-to-one or small group basis. All of these components contribute to a successful
conference experience. It is also worth noting that the format for the presentation
of papers at AusWeb has always been nontraditional. Papers were placed on
the Web a month before each conference to allow delegates to read and perhaps
make preliminary decisions about which sessions they might attend. At the
conference, presenters were restricted to 5 - 10 minutes overview/updates
with the bulk of the time then being made available for questions and discussion.
Where possible 3 or 4 papers were grouped by a common theme so that in effect
each session had elements of a mini-panel format. The focus of each session
was therefore to allow delegates the opportunity to discuss and question the
authors rather than have authors give a presentation directed at the delegates.
2. Background of Qualitative Data Analysis
Denzin and Lincoln (2000) have provided one of the latest comprehensive handbooks
on qualitative data analysis. It is over a thousand pages in length and contains
a total of 41 chapters on specific topics by professionals recognized in their
field as being authorities on the selected topic. Ryan and Bernard (2000)
and Silverman (2000) as well as earlier books such as Miles and Huberman (1994)
and Dey (1993) provide excellent descriptions of the steps involved in conducting
a qualitative data analysis, beginning with the raw text, and proceeding through
an iterative series of steps of coding, revising, forming categories and hierarchies,
and finally arriving at either a complete description or a conceptual model
of the meanings inherent in the text. Strauss and Corbin (1990) provide an
excellent description of grounded theory approaches. In order to reduce the
considerable labor involved in this process a number of software packages
have been developed (Weitzman, 2000). In the present case, a package called
MAXQDA (earlier versions were called WinMAX) (Kuckartz, 2001) [HREF1],
currently available only for the PC, was used to aid in the coding and reorganization
of the data. Hall and Ellis (1998) [HREF2]
have conducted a similar analysis of data from messages appearing on a listserv
discussion board, wwwdev, using a program called NUD*IST (Qualitative Solutions
and Research Pty Ltd., 1994) [HREF3].
Usually QDA approaches are applied to interview data where the researcher
is attempting to determine the underlying ideas and assumption of the discourse.
There may only be a few inteviews, although these can be quite lengthy. The
present situation is almost the opposite, with the data consisting of titles,
keywords and abstracts of a large number of papers. However in both of these
cases the approach taken is one that is described in the literature as "grounded".
One begins with the data, in our case text taken from the conference proceedings,
and creates a series of codes that in some sense capture the main ideas of
the papers. The goal is to provide an empirically grounded description of
the papers presented at each conference and to then make comparisons among
these descriptions. The next four major sections provide descriptions, based
on a qualitative data analysis, of the four conferences AusWeb95, AusWeb 96,
AusWeb2K and AusWeb01. Details for the first analysis are provided in greater
detail in order to give a sense of the form of the QDA.
3. AusWeb01
AusWeb01 took place in April 2001 in Coffs Harbour, New South Wales. A total
of 26 refereed papers were presented.
3.1 Analysis of Paper Titles for AusWeb01
Let's begin with a description of exactly what is involved in coding just
the titles of the papers. The title of the first paper is "Inter-Study
Comparisons of Small Business Internet Use in Australia and New Zealand".
Should the word "Inter-Study" be a code? What about "Comparisons"?
Or should there be one code, "meta-analysis" to cover both of these
words? We might combine these alternatives by creating a code called meta-analysis
and then have the other two codes as sub-codes of this. Then we consider the
phrase "Small Business". This looks to be the main topic of the
paper. How important is the adjective "small"? Should I adopt the
previous strategy and create a code called Business and then create Small
Business as a sub-code, or should I simply code this as Business? The phrase
"Internet Use" can likely be ignored, since all papers at the conference
are likely to be about the Internet. Finally, are the names of Australia and
New Zealand significant? Should they be included as codes? What has just been
described is illustrative of a "ground-up" approach to QDA. One
begins with the data, in this case the titles of the papers, and tries to
create a set of codes that captures the words in the titles. As one can readily
see, this might entail a fair amount of careful work with the time taken to
be out of proportion to the possible benefits of the analysis. If nothing
else, at least this description may engender some respect, and sympathy, for
those who engage in this type of research. We will return to this when we
consider the keywords for each article.
A second approach is to begin with a small number of pre-established categories,
for example, the four tracks used in previous conferences, and add to them
if necessary as one reviews the papers. In this case the analysis is relatively
coarse-grained. Since the titles are often not sufficiently informative, it
is an easy matter to also scan the abstracts to obtain a better sense of the
paper. Thus the first paper might be categorized as "Business".
Continuing this approach yields the breakdown shown in Figure 1.
|
Category
|
Paper ID
|
| Education |
2, 3, 4, 6, 7, 8, 11, 12, 13, 14, 15, 17, 18, 20, 21, 22, 23, 24, 25 |
| Business |
1, 9, 19, 26 |
| Technical |
5, 16 |
| Society |
10 |
Figure 1 AusWeb01 categories for refereed papers, N = 26
It turned out, at least for this analysis, that the defining criteria was
the environment within which the activity was located, rather than the type
of activity. It is not too difficult to revisit the articles and code the
papers to provide this additional information. The approach is still basically
grounded, with the codes being created as one proceeds through the papers.
The large number of papers in Education is the result of the granularity of
the earlier analysis and is an incentive to look for codes that are more informative
and which provide a clearer description of the content of the papers.
Each paper was assigned a single code based on the content of the title and
abstract. The resulting nine codes for Education are shown in Figure 2.
|
Codes
|
Paper ID
|
| online courses |
7, 8, 13, 21, 23 |
| administration |
11, 17, 18 |
| information retrieval |
2, 15, 25 |
| portals |
3, 4, 22 |
| authoring |
24 |
| community |
12 |
| research |
6 |
| simulation |
14 |
| staff development |
20 |
Figure 2 AusWeb01 codes for Education papers N = 19
3.2 Analysis of Keywords for AusWeb01
Authors were asked to supply a list of keywords to accompany their paper.
Such a list has two main uses. It presumably allows a potential reader to
use some form of search capability to see if a collection of papers contains
any matches to a list of keywords supplied by the reader, a match indicating
that the paper might be of related interest to the reader. This is basically
an algorithmic procedure and usually requires a "perfect match"
between a word or phrase supplied by the reader and the words or phrases supplied
by the author. Often a difference as small as an upper case letter, the difference
between a singular and plural form of the word, or the use/absence of a hyphen
are enough to prevent a match being detected.
There are three main ways to create a set of keywords for an article. The
first, easiest, and most common is to ask the authors to supply the keywords.
This had the additional advantage of leaving control in the hands of the author
who presumably is in the best position to know what the article is about.
The main weakness of this approach is the lack of any concordance or even
soft standard as to what criteria should be followed in making the list of
keywords. As a result there is the potential for a wide range of approaches
and resulting lists of keywords. A second way to create the list is to have
someone or some small committee review all of the papers and make the list.
This has, at least on the surface, the appearance of a common frame of reference
and standard, but it has the major weakness of perhaps missing the essential
idea or points of the article. It can also be quite time consuming for the
conference organizers. A third approach is to use a software program to automatically
scan the article and select out the keywords. It is an idea that may have
merit in principle, but the field of semantic analysis even leaves that as
an open question. At the moment the question of using keywords comes down
to a decision between asking the authors to supply such a list or to ignore
the idea completely.
The analysis of the keywords for each article began with a strict observance
of exactly what was supplied by the authors. In this case Figure 3 provides
a summary of the exact keywords for the total of 26 papers (2 papers failed
to supply keywords).
|
Keywords in the AusWeb01 papers
|
Frequency
|
| World Wide Web |
7
|
| Online Education |
6
|
| portal, E-business |
4
|
| Portals, personalization, customization, Management |
3
|
| 26 different words or phrases |
2
|
| 117 different words or phrases |
1
|
Figure 3 AusWeb01 frequency of keywords in titles of refereed
papers, N = 24
Using the algorithmic criteria of a "perfect match" it appears
that these papers have almost nothing in common. For a particular search using
any of the 143 words in the bottom two rows would yield only 1 or 2 hits.
This illustrates the weakness of using a search engine to search keywords
since the likelihood of a match for any particular keyword is remote. This
point is well understood by librarians, information retrieval officers and
engineers such as Tim Berners-Lee:
"The usual problem with keywords," Tim pointed out, "is
that two people never choose the same keywords." And while people may
recognize similarities in meaning between words, computers do not. (Gillies
& Cailliau, p. 183)
The other possible use of the keywords is more personal and heuristic: a
potential reader will scan the list and form a preliminary judgment that the
article is of interest. Even here, that is a questionable assumption. Most
readers are likely to do a very rapid scan of the entire article and then
form a judgment about its' potential value. However let's see what happens
when we begin to adjust the keywords to take into account minor differences
in spelling. As a start we can delete the keywords World Wide Web or WWW or
Web since it may be safely assumed that all papers are on that topic.
If you have engaged in QDA you realize that it can
quickly become very complex. There is a high level of judgment involved in
determining the meaning of a particular code, and in deciding whether a particular
code should, or should not, be considered a sub-code of another code. Other
issues related to synonyms, and to context, can become difficult. Even authors
who may not be interested in qualitative approaches may be sensitive to some
of the problems. For example, the supplied keywords for one paper included
the following: "Electronic commerce, e-commerce, eCommerce, electronic
business, e-business, eBusiness, electronic marketing, e-marketing, eMarketing,
online marketing, small business, Internet commerce, World Wide Web, Web".
At the other end of some imaginary continuum was a paper with the following
list: "BURKS, CD-ROM, educational software".
A decision was made to drop the analysis of keywords from the remainder of
the study. It might even be suggested that this component be dropped from
paper submissions to the conferences, and perhaps the idea might be extended
to professional journals as well. The original intent would appear to have
merit, but it does not appear to bear up well under scrutiny.
3.3 Analysis of the Abstracts for AusWeb01
Given the generally efficient method of forming categories when looking at
the titles, but which often involved a reading of the Abstracts as well, and
given the difficulties encountered when attempting a coding using the supplied
keywords, it was reasonable to doubt that much additional value would accrue
from a detailed coding of the abstracts. One advantage with this attempt was
that the researcher had control over the codes and could thus restrict the
proliferation of synonyms. Figure 4 is a partial screen capture from the program
MAXQDA showing the codes that have been inserted for the first abstract. The
codes are in the left margin (in green). Clicking on a code highlights the
text in the document that received that code. This allows one to distinguish
between codes that appear as a direct copy of the author's vocabulary as compared
with a code that might be a paraphrase created by the researcher. The clear
majority of codes in this study were direct quotes.
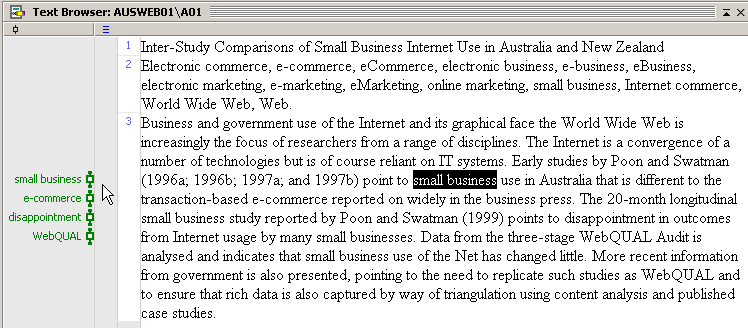
Figure 4 Screen display of coding process showing highlighted
text and in the left column the code name and code marker
One can then obtain a list of frequencies for any group of selected
papers. For example, Figure 5 gives the frequencies of codes for the four
business papers identified in Figure 1.
|
Frequency
|
Code
|
|
3
|
e-commerce |
|
2
|
small business |
|
1
|
bandwidth, current usage, disappointment, globalization,
governance, income, intended use, isolated organizations, mobile agents,
reliable, security issues, taxation, underlying knowledge, WebQUAL |
Figure 5 AusWeb01 display of frequency and codes for Business
papers
A scan of this list is more informative than the simple categorization
of the papers as being about Business. This suggests that the effort involved
in coding the abstracts for the papers for Education might in fact be worthwhile.
Figure 6 shows the most frequent codes for the 19 Education
papers.
|
Frequency
|
Code
|
|
8
|
Online Education |
|
6
|
post-secondary/higher education |
|
4
|
portal |
|
3
|
customization, personalization, Web-based instruction |
|
2
|
flexible delivery, infrastructure, interoperability, management,
metadata, subject gateway, survey, university, |
|
1
|
68 individual codes |
Figure 6 AusWeb01 display of frequency and codes for 19 Education
papers
The codes give an improved sense of the content of these papers.
While variety is the norm, particularly with the codes occurring only once,
one nonetheless has a clearer sense of the nature of that variety.
It is also possible to construct a more fine grained analysis.
For example, Figure 7 shows the codes in papers about online courses. These
codes had the same structure, namely very little overlap of codes and an increasingly
long list of unique identifiers. Further analysis placed these 54 codes into
3 categories: Course Design, Course Evaluation and Staff Issues, which gave
a clearer picture of the topics mentioned in these seven papers.
|
Category
|
Codes
|
| Course Design |
language learning, document creation, delivery model,multimedia, offline
use, distance education, disadvantages, Hybrid Delivery System, combination
of online and traditional methods, computer literacy skills, interactivity,
personalization, customization, audio visual interactive, courseware management,
CD-ROM |
| Course Evaluation |
remote campuses, Computer Science students, network bandwidth, increased
flexibility, evaluation, viewed online favorably, lack of resources, eleven
recommendations, lack of immediacy in feedback, difficulties, perceptions
of students |
| Staff Issues |
amount of traditional teaching, Faculty of Applied Science, goals and
plans, actual implementation steps, practical support, principles for
guiding on-line development, large number of projects, funding, technological
barriers, little involvement in on-line delivery, doubts about benefits
for students, doubts about on-line pedagogy, mistrust of institutional
motivation, enthusiastic early adopters, leadership and mentoring, Web-based
presence for all courses, empowering of staff, staff development |
Figure 7 AusWeb01 categorization of codes in papers on "Online
Courses"
In addition to the above summary, the codes from the QDA permit a more detailed examination of the similarities among
the 26 papers. For example, it is not that difficult to construct a matrix
where the rows and columns are the paper IDs, and the number in the cell where
a row and column intersect provides the frequency of the number of nodes that
the two papers have in common. In the present case this matrix looks like
this:
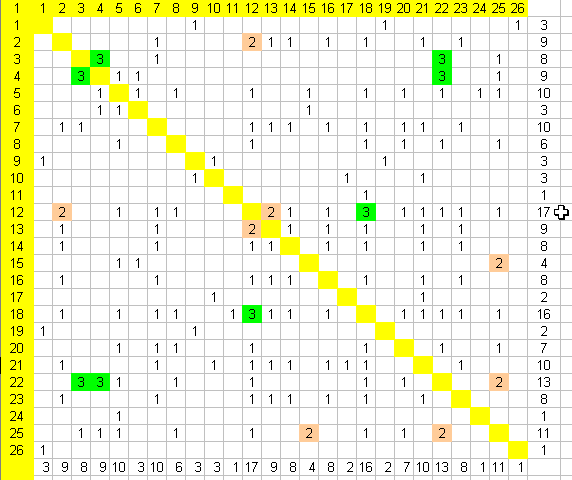
Figure 8 Similarity matrix showing the number of codes that
any two AusWeb01 papers have in common
The numbers identifying the rows and columns refer to the number
of the refereed paper. The cells highlighted in dark grey (green on screen)
indicate the papers that have 3 codes in common. For example, papers 12 and
18 have the codes "Online Education", "Web-based instruction"
and "post-secondary/higher education" in common. The mid-grey (tan)
cells indicate papers that have two codes in common. Looking at the total
number of common codes for each paper, displayed as the rightmost column,
it also becomes apparent that paper 12 has the most codes (17) with the conference
as a whole. At the other end of the scale, papers 11, 24 and 26 are virtually
unique with only 1 code in common with another paper.
Figure 9 is a graphic image (generated by the software package
Inspiration [HREF4]) for this situation
for the 26 papers. In this case each paper (the numbered circles) has a line
corresponding to the commonality of codes with the other papers. The additional
numbers on some of the lines indicates the number of codes that two papers
have in common. These lines are also thicker and on the screen display, are
in color (red for 3 common codes, green for 2 common codes). The overall pattern
shows a visual representation of the interconnectedness among the papers.
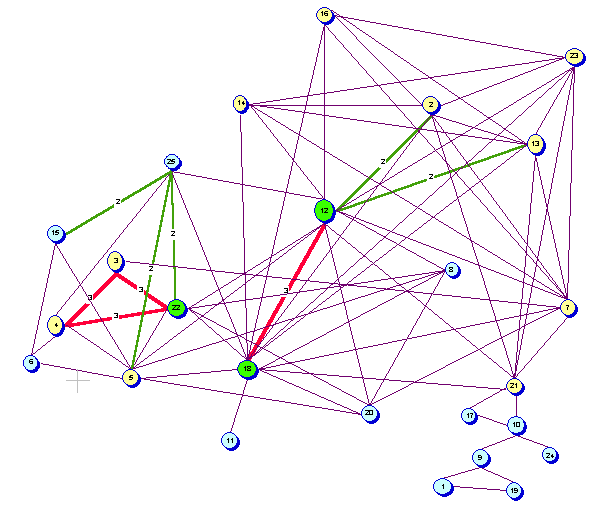
Figure 9 Connections among the AusWeb01 papers based on common
codes
Another way to organize this information is by the frequency
of codes. This provides a useful index if one is interested in noting whether
a particular topic is discussed in the collection of papers.
|
Code
|
Paper ID
|
| online education |
2, 7, 12, 13, 14, 16, 18, 21, 23 |
| post-secondary/university |
5, 8, 12, 18, 20, 22, 25 |
| portal |
3, 4, 22, 25 |
|
customization
|
3, 4, 22 |
| e-commerce |
1, 9, 19 |
| infrastructure |
4, 5, 6 |
| management |
10, 17, 21 |
| personalization |
3, 4, 22 |
| Web-based instruction |
12, 13, 18 |
|
design
|
5, 24 |
|
flexible delivery
|
11, 18 |
|
governance
|
9, 10 |
|
interactive learning
|
7, 20 |
|
interoperability
|
6, 15 |
|
learning environment
|
5, 15 |
|
metadata
|
15, 25 |
|
small business
|
1, 26 |
|
subject gateway
|
15, 25 |
|
survey
|
3, 7 |
Figure 10 Frequency of codes in AusWeb01 papers
However it is worth noting that these displays are nowhere near as useful
as the actual dynamic use of the MAXQDA software, where one can not only see
which papers may have a common topic but that with a mouse click you can go
directly to that particular section of the appropriate document. This is the
real strength of software developed for QDA and is the reward for the hours
spent coding the raw data.
4. AusWeb95
As is often the case with empirical research, the expectations of the researchers
may be at variance with the reality being examined. It turns out that the
format for papers in 1995, the first conference, did not include abstracts.
After a bit of thought, and a check to see if it was feasible, it was decided
to extract the introductory and concluding sections of each paper and treat
that as a (slightly larger!) abstract. This appeared to work reasonably well
and a resulting text file of about 60 pages was assembled. A total of 60 refereed
papers was used in this analysis. Having discarded the idea of further analysis
of the keywords, the analysis focused on a combination of title and extracts
as the textual database for a QDA.
The conference was organized into sessions with the following titles (the
numbers refer to the session ID used in the conference):
1. Education (with a Science flavour)
2. Libraries
3. Education (with a flavour of application to learning)
4. Hypertext theory, interfaces, presentation standards
5. Education
7. Education
8. Web tools
9. Management Tools
10. The Web Future & Commerce on the Web
11. Publishing on the Web
12. Indexing, caching, robots, spiders
13. Collaborative use of the Web, sociology of the Web
15. Connectivity and emerging services
16. Integrating external applications
(Note: sessions 6 and 14 were non-paper sessions)
These 14 sessions were reorganized into the 4 tracks (or categories) used
for the conference.
|
Category
|
Track ID
|
No. of Papers
|
| Education |
1, 3, 5, 7 |
18
|
| Business |
10 |
5
|
| Technical |
4, 6, 8, 9, 10, 12, 15, 16 |
23
|
| Society |
2, 11, 13 |
14
|
Figure 11 Categories for all refereed papers in AusWeb95
Two types of subsequent analysis were performed: one on each of these categories,
the other on the combined total of 60 papers.
Let's examine the categories first, before combining the data. For Education,
a total of 18 papers were coded. The coding was restricted to one occurrence
of the code for each article. Thus the numbers correspond to the number
of papers that had that code.
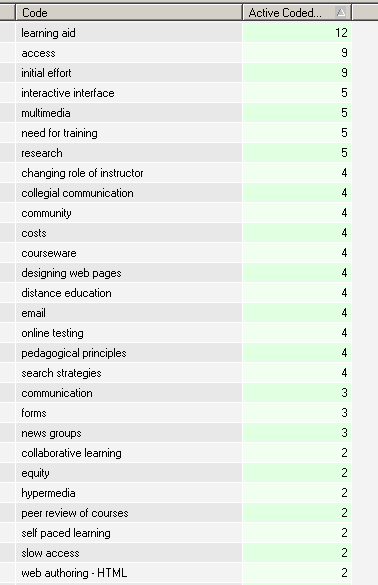
Figure 12 Partial screen capture showing code names and
frequency for Education papers in AusWeb95
Another 14 codes occurred in 1 article each, for a total of 42 descriptors.
Figure 13 gives a sense of the topics that were important to the Education
track in 1995.
|
Category
|
Codes
|
freq. |
| Web support for Courses |
learning aid, courseware, designing Web pages, online testing, pedagogical
principles, self-paced learning, Web authoring - HTML, computer managed
learning environment, mixed Internet-CDROM delivery, simulation, |
10 |
| Implementation |
access, initial effort, costs, distance education, copyright, index,
planning, school education, |
8 |
| Technology |
interactive interface, multimedia, email, forms, newsgroups, hypermedia,
slow access, ftp, gopher - WAIS, pdf, problems with browsers |
11 |
| Implications |
need for training, research, changing role of instructor, collegial
communication, community, search strategies, communication, collaborative
learning, equity, peer review of courses, censorship, security, student
publishing |
13 |
Figure 13 Categorization of codes in papers on Education
in AusWeb95
The above analyses are intended to show the level of detail that a grounded
QDA description can provide. Although it is possible to continue providing
this level of analysis and description for AusWeb2K and AusWeb96, the primary
purpose was to compare the results of such an analysis for all four conferences
that span the time from 1995 to 2001.
5. Combined Analysis for the Codes for AusWeb95, 96, 2K, 01 Conferences
To facilitate comparisons, a separate table (Figure 14) was constructed showing
the number of papers for each of the four categories.
| Category |
AusWeb95
|
AusWeb96
|
AusWeb2K
|
AusWeb01
|
Total
|
| Education |
18
|
25
|
14
|
19
|
76
|
| Technical |
23
|
18
|
13
|
2
|
56
|
| Business |
5
|
8
|
5
|
4
|
22
|
| Society |
14
|
7
|
0
|
1
|
22
|
|
Total No. of Papers
|
60
|
58
|
32
|
26
|
176
|
Figure 14 Categorical distribution of refereed papers for
all 4 AusWeb conferences
Finally, each of these four categories was organized by the
successive AusWeb conferences and a list of the codes used within each category
was displayed by the relative frequency of its occurrence. Figures 15 to 18
provide a comprehensive summary of the codes utilized by the authors of these
176 papers.
|
Category
|
Codes
|
|
Education
|
| AusWeb95 |
[13 times] learning aid
[9 times] access, initial effort
[6 times] multimedia
[5 times] changing role of instructor, community, interactive
interface, need for training, research
[4 times] collegial communication, costs, courseware, designing
Web pages, distance education, email, online testing, pedagogical
principles, search strategies
[3 times] communication, forms, newsgroups.
[2 times] collaborative learning, equity, gopher and WAIS, hypermedia,
peer review of courses, self-paced learning, slow access, Web
authoring.
[1 time] administration, censorship, computer managed learning
environment, copyright, ftp, index, mixed internet/CD-ROM delivery,
pdf, planning, problems with browsers, security, simulation, student
publishing.
|
| AusWeb96 |
[5 times] collaborative teaching and learning.
[4 times] online support for courses.
[3 times] CGI, distance education, electronic journal, instructor
acceptance, managing courses, staff development.
[2 times] courseware, email, hypertext, K-12, multimedia, navigation,
privacy, security, Web server.
[1 time] alliance networks, annotations, career option, cost,
experiential model of learning, indexing tools, interactive Web
pages, learner control, mailing lists, modular, narrative, online
testing and grades, pedagogy, prepublication, reflection, research,
self-paced learning, social/political, student perceptions, WAIS
and gopher, Web authoring Web forms.
|
| AusWeb2K |
[3 times] pedagogy, Web searching.
[2 times] collaborative learning process, e-mail, evaluation,
metadata, staff development, students, Web-based course design,
Web-based learning, XML.
[1 time] attitudes, cultural background, knowledge management,
multimedia, on-line communities, public access, security, subject
gateways, teaching and learning center, W3C, Web-based assessment,
Web page collaboration tools, Web teams.
|
| AusWeb01 |
[4 times] portal.
[3 times] Web-based instruction, personalisation, customisation.
[2 times] survey, subject gateway, metadata, management, interoperability,
infrastructure, flexible delivery, situated learning, staff development.
[1 time] authentic activities, authoring, AVEL, Bioinformatics,
BURKS, CALL, CD-ROM, census, change management, classroom, cognitive
apprenticeship, collaborative learning, community, computer literacy,
computer mediated communication, conceptual tool, copyright, CORBA,
costs, customer service, deconstructing, design,distributed computing,
educational software, enculturation, hyperspace, information access,
information management, integration, intellectual property, interactive
environment, interactive learning, metaphor, multimedia, online
courseware development, online registration, ownership, self-study,
sense-making, simulation, situated learning, staff development,
technical support, Web-based course management system, XML.
|
|
Figure 15 Codes used by Education refereed papers
|
Category
|
Codes
|
|
Technical
|
| AusWeb95 |
[11 times] databases
[7 times] access, designing Web pages, search strategies.
[5 times] costs, email, multimedia.
[4 times] cgi, community, forms, hypermedia, index, Web server.
[3 times] communication, ftp, initial effort, research, security.
[2 times] administration, authority, bandwidth, common client
interface, gopher & WAIS, government information, navigation,
provide information about organization, slow access, Web authoring.
[1 time] collaborative research, concept map, copyright, course
materials, courseware, empower, image compression, interactive
interface, library, need for training, newsgroups, planning, video
conferencing, work at home.
|
| AusWeb96 |
[4 times] hypertext
[3 times] multimedia, navigation, Web server.
[2 times] CD-ROM, intranet, search tools, security.
[1 time] adaptive systems, ATM, Bifocal display, e-commerce, email,
hard-copy printing, ISDN, Java, Legacy, modular, notebook computer,
PGP, public domain, search agent, shareware, software robots, Spider,
user authentication, Web authoring, Web browsers, wide area network. |
| AusWeb2K |
[3 times] evaluation
[2 times] electronic profiling, navigation, privacy, usability,
Web page collaboration tools.
[1 time] automated analysis, client-side scripting, collaboration,
collection, commercial data collections, contextual information,
data-centric approach, database, design, DHTML, e-commerce, hierarchically
organized, legal position, multifaceted approach, multimedia,
online marketing research, personal information, project management,
scale up, search engines, site management, students, thematic-based
collection, upgrading, Web searching, Web server, Web teams, XML,
XQL, XSL.
|
| AusWeb01 |
[1 time] design, development, forum software, forums, hybrid delivery
system, HyWeb, implementation, infrastructure, learning environment,
online, online education, post-secondary/higher education, university,
WBI. |
|
Figure 16 Codes used by Technical refereed papers
|
Category
|
Codes
|
|
Business
|
| AusWeb95 |
[3 times] communication.
[2 times] costs
[1 time] administration, collaborative research, community, copyright,
databases, email, government information, initial effort, planning,
social movements, video conferencing, work at home. |
| AusWeb96 |
[5 times] e-commerce
[4 times] intranet
[2 times] database, marketing, small companies
[1 time] cost, email, entrepreneurship, ISP, large companies, research,
security. |
| AusWeb2K |
[3 times] e-commerce.
[2 times] marketing, online business models, portal.
[1 time] barriers to e-commerce adoption, diffusion models, economic
development, online marketing research, productivity increases,
residential real estate market, service augmentation, social development,
trade hubs.
|
| AusWeb01 |
[3 times] e-commerce.
[2 times] small business.
[1 time] bandwidth, current usage, disappointment, globalisation,
governance, income, intended use, isolated organizations, mobile
agents, reliable, security issues, taxation, underlying knowledge,
WebQUAL.
|
|
Figure 17 Codes used by Business refereed papers
|
Category
|
Codes
|
|
Society
|
| AusWeb95 |
[7 times] access
[6 times] research
[5 times] collaborative research, communication, electronic publishing
[4 times] costs, databases, library, search strategies.
[3 times] community, gopher & WAIS, hypermedia.
[2 times] changing role of librarian, collegial communication,
designing Web pages, email, forms, ftp, initial effort.
[1 time] bandwidth, cgi, ease of use, electronic journal, empower,
equity, gender, government information, identity, index, listservers,
multimedia, need for training, planning, rapid change, refereeing
process, slow access, social interaction, Web server, work at
home.
|
| AusWeb96 |
[2 times] censorship, copyright
[1 time] archives, collaboration, community, cost, feminist deconstruction,
free public access, gender bias, intranet, legislative measures,
marketing, policy, research, security. |
| AusWeb2K |
none
|
| AusWeb01 |
[1 time] content, control, filtering, gambling, governance, IP
blocking, management, monitoring, moratorium, prevention. |
|
Figure 18 Codes used by Society refereed papers
All four tables are both rich and suggestive as well as to some
extent fragile. Rather than attempt to state a definitive set of conclusions
we would like to suggest of couple of possible interpretations. This leaves
the way open for delegates and other readers to draw their own additional
conclusions.
Education papers showed a shift away from building operational
Web sites to a concern for pedagogical principles that take into account the
technological character of the Web. Collaborative learning was a common theme
in all four conferences whereas design and a concern for the learning process
became mentioned increasingly often. Technical papers maintained a focus on
integrating database technology with the Web, interest shifting from cgi-scripts
to client-side approaches. The evolution of markup languages from HTML to
DHTML and XML is also reflected in the papers. Not surprisingly, papers in
the Business category centered on e-commerce with a discernible continuing
interest in small business environments. Recent business papers show evidence
of more pragmatism and even disappointment with some of models. The final
group of papers, loosely identified as "Society" are more idiosyncratic
and show a sensitivity to a wide range of social issues such as government
control, privacy, security, gender bias and equity.
6. Demographic Analyses Across AusWeb95, 96, 2K and 01
Three tables (Figures 19, 20, 21) were created that provide information on
gender, geography and broad category of topic. The gender distribution (Figure
19) of the presenters was computed based on the approximately 80% of the names
that had a popular gender connotation. The ratios are strikingly consistent
across the four conferences.
| Conference |
M (%)
|
F (%)
|
| AusWeb95 |
75
|
25
|
| AusWeb96 |
68
|
32
|
| AusWeb2K |
65
|
35
|
| AusWeb01 |
67
|
33
|
Figure 19 Gender distribution of presenters for all 4 AusWeb
conferences
Information about the geographic location of the presenters was collated
for each conference (Figure 20). Once again, the frequencies are quite stable.
|
Location
|
AusWeb95
|
AusWeb96
|
AusWeb2K
|
AusWeb01
|
Total
|
| Victoria |
21
|
9
|
12
|
10
|
52
|
| New South Wales/ACT |
17
|
19
|
8
|
5
|
49
|
| Queensland |
7
|
13
|
5
|
6
|
31
|
| West Australia |
5
|
6
|
1
|
1
|
13
|
| South Australia |
2
|
2
|
1
|
0
|
5
|
| Tasmania |
1
|
0
|
0
|
1
|
2
|
| International |
7
|
10
|
5
|
5
|
27
|
| Totals |
60
|
60
|
32
|
28
|
180
|
Figure 20 Geographical distribution of authors for all 4
AusWeb conferences
This shows a strong representation from Victoria, New South Wales/ACT and
Queensland. The most obvious interpretation of this pattern is the east
coast venues for the conferences. Numbers from other states were appreciably
less, falling to no representation from some states in some years. The international
presenters came from Belgium, Canada, England, Greece, Hong Kong, Ireland,
Italy, Japan, New Zealand, Singapore, Switzerland and the United States.
It is worth noting that each conference had a contingent of international
presenters.
8. Summary and Comments
What did we say? The fine grained analysis (Figures 15 to 18) shows the diversity
of topics addressed by presenters at the conference. When looked at across
the years, Education and Business showed a fairly level pattern of contribution.
The Technical area had a contribution level similar to Education in all except
the last year. Society showing a marked decrease between the first two years
and the last two years.
This analysis has demonstrated that a grounded QDA of just the titles and
abstracts can be used to provide a fine-grained description of the content
of papers presented at a conference. The approach was also able to identify
many of the specific topics and issues within papers as well as links among
papers. The tables providing a detailed list of the coding for the papers
may give rise to a new set of investigations from readers whose interest had
been stimulated by a perceived trend or piqued by a particular word or phrase.
The results may also provide future conference organizers with a basis for
designing a call for papers that builds on areas of increasing popularity,
or conversely, suggests topics that appear to be waning.
This paper has demonstrated an application of QDA to a topic not normally
subject to such analysis. The ideas and issues underlying QDA are also central
to those that will support the development of a theme that will almost certainly
be of major interest at future AusWeb conferences - the Semantic Web.
References
Denzin, N. K. & Lincoln, Y. S. (Eds.) (2000). Handbook of qualitative research.
2nd ed. Thousand Oaks, CA: Sage Publications.
Dey, I. (1993). Qualitative data analysis: A user-friendly guide for social
scientists. London: Routledge & Kegan Paul.
Gillies, J. & Cailliau, R. (2000). How the Web was born. Oxford: Oxford
University Press.
Hall, R. & Ellis, A. (October, 1998). What do Web-based courseware developers
discuss? A qualitative analysis of the WWWdev Listserv. Proceedings of the North
American Web Developers Conference, Fredericton, New Brunswick, Canada.
Kuckartz, U. (2001). MAX Qualitative Data Analysis Introduction. VERBI Software.
Berlin: Germany.
Miles, M. B. & Huberman, A. M. (1994). Qualitative data analysis: An expanded
sourcebook. Thousand Oaks, CA: Sage Publications.
Qualitative Solutions and Research Pty Ltd. (1994). Q.S.R. NUD*IST Revision
3.0. User Guide. Melbourne, Australia: Qualitative Solutions and Research Pty
Ltd.
Ryan, G. W. & Bernard, H. R. (2000). Data management and analysis methods.
In N. K. Denzin & Y. S. Lincoln (Eds.) Handbook of Qualitative Research.
2nd ed. Thousand Oaks, CA: Sage Publications. 769 - 802.
Silverman, D. (2000). Doing qualitative research: A practical handbook. London:
Sage Publications.
Strauss, A. & Corbin, J. (1990). Basics of qualitative research: Grounded
theory procedures and techniques. Newbury Park, CA: Sage Publications.
Weitzman, E. A. (2000). Software and qualitative research. In N. K. Denzin
& Y. S. Lincoln (Eds.) Handbook of Qualitative Research. 2nd ed. Thousand
Oaks, CA: Sage Publications. 803 - 820.
Hypertext References
HREF1
http://www.maxqda.com
HREF2
http://naweb.unb.ca/proceedings/1998/hall/hall.html
HREF3
http://www.qsr.com.au/
HREF4
http://www.inspiration.com/