2009 Daley Log
Page 23
My goal today is to spend 2 hours reviewing my notes (both handwritten and web site) for calculus. I would also like to spend 2 hours later today on modeling (STELLA), but that is a secondary goal.
I created a table yesterday that I found immediately useful:
function a relationship between 2 sets. It maps every element in the domain to one, and only one, element in the range set a collection of objects element an object in a set domain the set of elements in the first set range the set of elements in the second set mapping a method for pairing the elements of two sets. It assigns values of the dependent variable to values of the independent variable variable a collection of elements independent variable a nonspecific element in the domain dependent variable a nonspecific element in the range ordered pairs one method of defining a mapping relation a mapping represented by a set of ordered pairs inverse function obtained by transposing the domain and range graph a diagram showing all the ordered pairs of a relationship vertical line test if all vertical lines intersect the graph only once, then it is a function horizontal line test if all horizontal lines intersect the graph only once, then the inverse is a function
Principles for Learning calculus:
function a rule for transforming one object (element) to another. The transformation must also be unique codomain the set of potential values for the range. Usually this is the set of all real numbers. inverse function given a function f, its inverse is the reverse mapping or transformation. given the graph of a function, its inverse is the reflection of the graph about the line y = x there are 2 issues here. One is the idea of an inverse. The other is whether the inverse is a function. vertical line test used to determine if a rule is a function. all possible vertical lines must cut the graph at only one point. horizontal line test used to determine if the inverse is a function. all possible horizontal lines must cut the graph at only one point
There is a nice play between the strict algebraic formulation for an inverse and the use of graphical procedures. The algebraic approach may give one the inverse, but at the same time the user may have almost no idea of what it looks like. This may be a place where Mathematica could be useful. First, use Mathematica to find the inverse expression. Then use Mathematica to graph that function. |
composite function Given 2 functions, f and g, then the composite function f o g is formed by substituting the expression for g for the symbol x in the expression for f.
There are 3 different "types" of operations involving functions: standard computational operations (addition, subtraction, multiplication, division, exponentiation, etc.), inverse, and composition.
With inversion and composition it is often difficult to visualize what the resulting function may "look" like. This is even true with most standard computational operations.
But practice with manipulating various symbolic expressions should build confidence in one's ability to work out the implications of such operations. There is a skill in being able to do this with confidence, even if one is not sure what the result really looks like.
even function f is called even iff f(x) = f(-x) odd function f is called odd iff f(-x) = -f(x) most functions are neither odd nor even if a function is either odd or even then you know that the graph has some form of symmetry. If even, then the graph is symmetric about the y-axis. If odd, the graph is symmetric about the origin.
Can a function be BOTH odd and even?
No. If it were, then the graph would be symmetric about both the y-axis and the origin, which is impossible.
So far, we have been assuming that we are working in 2 dimensions with real numbers.
Extending this to 3 dimensions seems straight forward but the symbol manipulation becomes both more complicated as well as tedious.
Extending this to 4 or more dimensions is still straight forward algebraically, but it becomes difficult (if not impossible) to visualize.
Another type of extension is to ask what happens if the number of dimensions becomes fractional. This leads to fractals - a new branch of mathematics first discovered by Mandelbrot in the 1970's. It is amazing that the idea is that new.
I am not sure what happens when one plays with negative dimensions, or complex dimensions. But this is what mathematics is all about - extending ideas into the unknown.
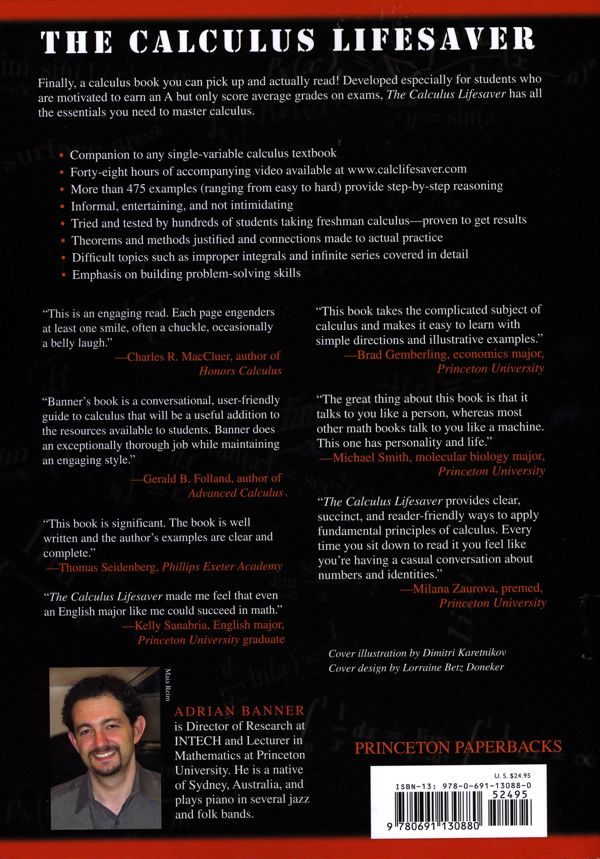
Today I have reviewed my handwritten notes corresponding to chapter 1 Functions, Graphs and Lines from "The Calculus Lifesaver" by Adrian Banner.
Looking at the three books that I am using, I feel that I should back off from the calculus for a moment and spend some additional time with Jack Weiner's book, "The Mathematics Survival Kit" which covers a lot of basic algebra and trigonometry. This will also provide me with some genuine hands-on practice.
I am excited with my progress this morning. I genuinely feel that I understand the concepts related to functions, their inverses and compositions, as well as the idea of odd and even functions.
And I think I have the basic structure for this web site under control as well.
Here is the link to my handwritten work for today:
 (none for today)
Books on the Go Today |
|
 |
see below |
